A KPI moved. Nobody knows why.
Revenue, margin, volume, price, mix, segment, and channel analysis to isolate what changed, quantify the drivers, and identify where management should investigate next.
PRIMARY IDENTITY · DATA & QUANTITATIVE ANALYST
I turn ambiguous business, financial, and economic questions into validated analysis, quantitative models, BI evidence, and decision-ready recommendations. AI evaluation and research automation strengthen that core analytical workflow rather than compete with it.
Evidence standard: reproducible public work, explicit assumptions, visible validation, and clear separation between analysis, interpretation, and real-world impact.
PROBLEMS I SOLVE
The fastest way to evaluate the portfolio is to match your problem to the proof below. Tools are supporting methods, not the product.
Revenue, margin, volume, price, mix, segment, and channel analysis to isolate what changed, quantify the drivers, and identify where management should investigate next.
Data-quality checks, KPI definitions, reconciliation, analytical SQL, reporting layers, and BI specifications that make metrics auditable before they reach a decision-maker.
Forecasts, downside/upside cases, break-even, unit economics, ROI, and sensitivity analysis for decisions involving price, volume, cost, cash, and growth assumptions.
Risk segmentation, model validation, evidence traceability, AI evaluation, and QA controls that distinguish a usable analytical output from an output that only looks plausible.
SELECTED WORK
The website carries the business story and evidence. GitHub remains the technical appendix for source code, data lineage, tests, outputs, and reproducibility.
AI-POWERED RETAIL SALES DIAGNOSTIC
A full decision diagnostic from raw-data quality controls to KPI construction, price-volume decomposition, mix analysis, anomaly triage, and recommendation design.
The synthetic case points to value dilution: lower-value mix and heavier discounting coincided with weaker revenue, profit, and margin outcomes. The evidence supports diagnosis, not causal attribution.
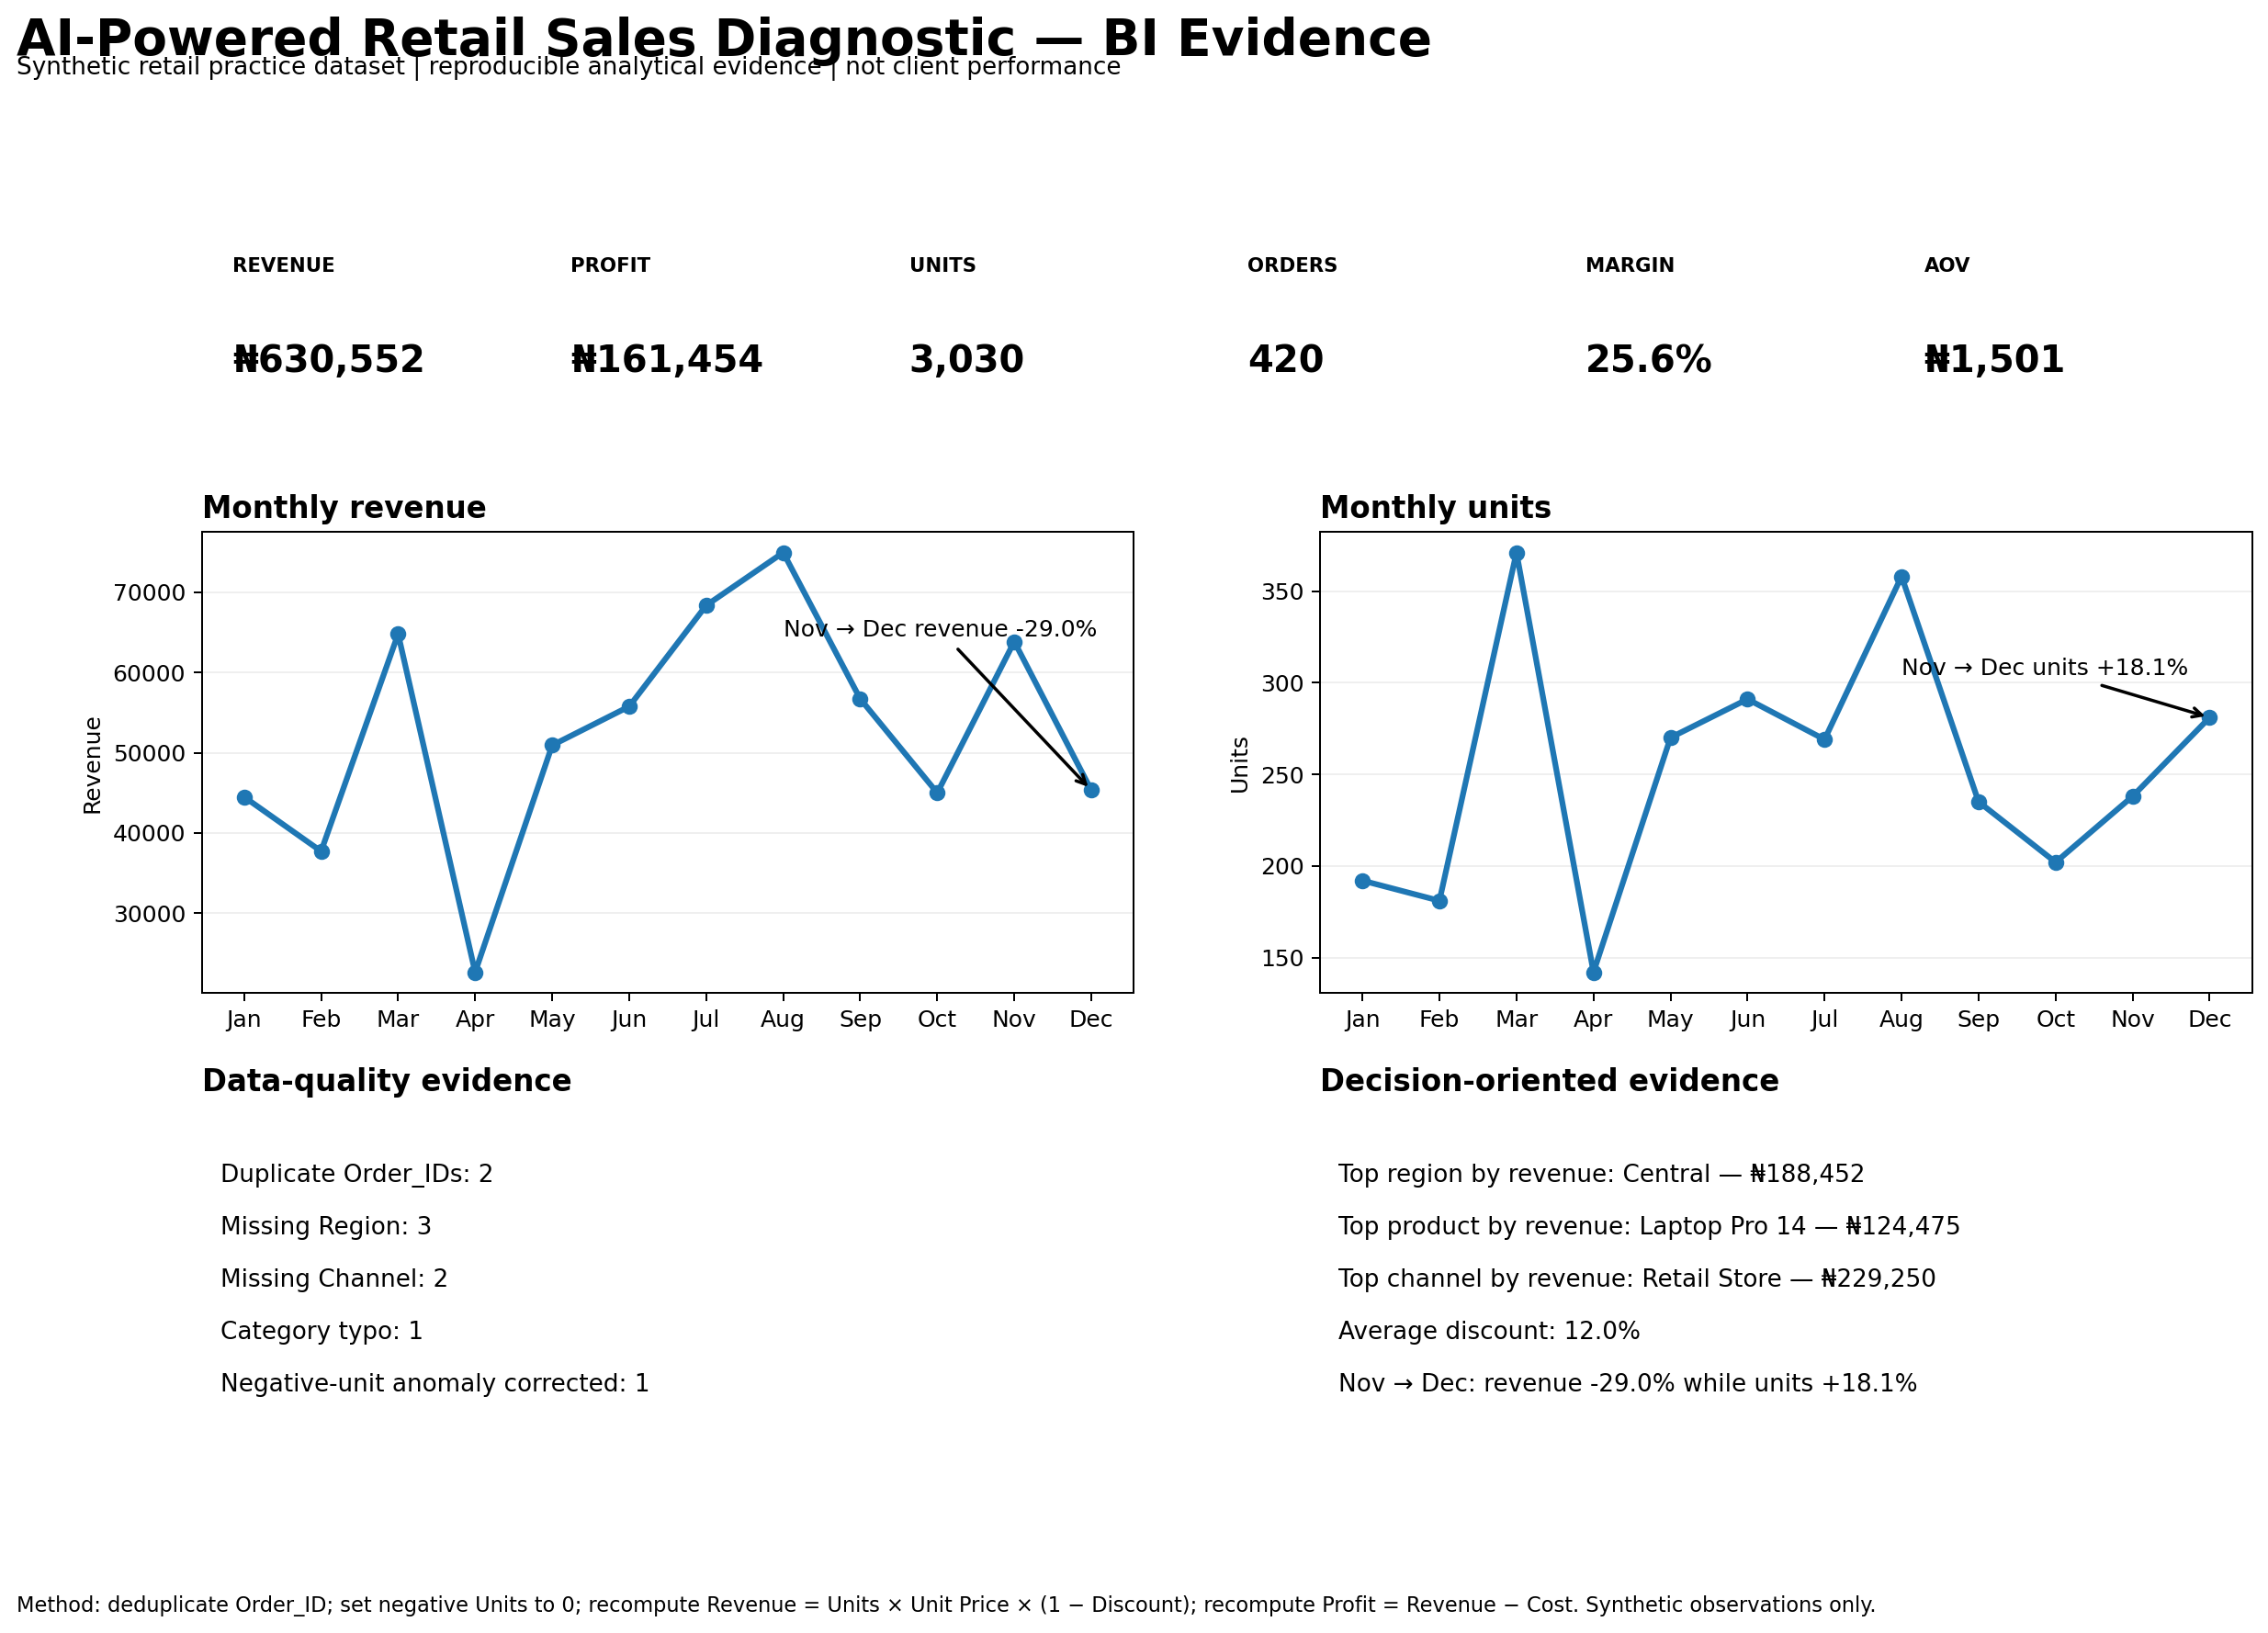
Problem solved: Turn a raw retail dataset into a reliable SQL-backed BI reporting layer that management can interrogate.
Proves KPI design, analytical SQL, dimensional comparisons, and a decision-ready BI structure.
Validated KPI views, analytical SQL, management comparisons, dimensional analysis, and a Power BI build specification that extend the flagship case.
Problem solved: Turn official public data into a compact, auditable monitor for economic and development context.
Proves public-data sourcing, metric definition, comparison, and decision-oriented communication.
Uses World Bank indicators to demonstrate applied data sourcing, metric definition, comparison, and decision-oriented communication outside synthetic datasets.
Problem solved: Translate borrower characteristics into measurable risk segments that can support consistent credit decisions.
Proves model evaluation, segmentation logic, and quantitative risk communication.
Problem solved: Show how operating assumptions change revenue, profit, cash generation, and downside/upside outcomes.
Proves forecast structure, scenario analysis, sensitivity testing, and model QA.
Problem solved: Quantify the commercial effect of changing price, volume, and cost assumptions before a decision is made.
Proves unit economics, break-even logic, ROI scenarios, and sensitivity analysis.
Problem solved: Test whether a dashboard or KPI is trustworthy enough to support a decision.
Proves schema validation, reconciliation, QA rules, and explicit PASS/REVIEW/FAIL controls.
Problem solved: Measure whether AI-assisted research is accurate, complete, traceable, and economical enough to rely on.
Proves evidence checks, evaluation criteria, traceability, and cost/latency awareness.
PROOF
Synthetic projects demonstrate method. Public-data work demonstrates applied sourcing. Client impact is only claimed when directly evidenced.
Yes. Source code, data-generation logic, assumptions, validation rules, tests, outputs, and methodological limitations are available for inspection.
Review technical evidence ↗Yes. The browser-first case-study layer puts the problem, method, evidence, conclusion, and limitations ahead of the technical appendix.
Browse decision evidence ↗Data & Quantitative Analyst is the core profile, with BI, financial analysis, research, and AI evaluation presented as connected analytical capabilities.
Read the CV ↗HOW I WORK
The differentiator is a disciplined path from question to recommendation, with assumptions, controls, and uncertainty visible.
Define the decision, metric, grain, audience, and constraints.
Understand the source, schema, coverage, provenance, and definitions.
Test quality, assumptions, reconciliations, identities, and edge cases.
Quantify drivers, patterns, scenarios, uncertainty, and alternatives.
Separate observed facts from interpretation and causal claims.
Connect the evidence to practical next actions, tests, and monitoring.
NEXT STEP
I’m open to remote Data Analyst, BI Analyst, Quantitative Analyst, research, and analytics project opportunities. Send the decision, data context, or role brief—not just a tool list.